Managing Facebook ads can be an overwhelming task. With 94% of social media marketers using the platform, it’s also a challenge to ensure your campaigns stand out. After all, 75% of businesses who use Facebook are willing to pay to promote their posts.
In this ultra-competitive environment, how do you realize the full potential of the world’s most popular social media platform?
The key is to develop a focused and highly-targeted Facebook advertising strategy. A significant part of this is identifying the key performance indicators (KPIs) that support the goals of your campaign.
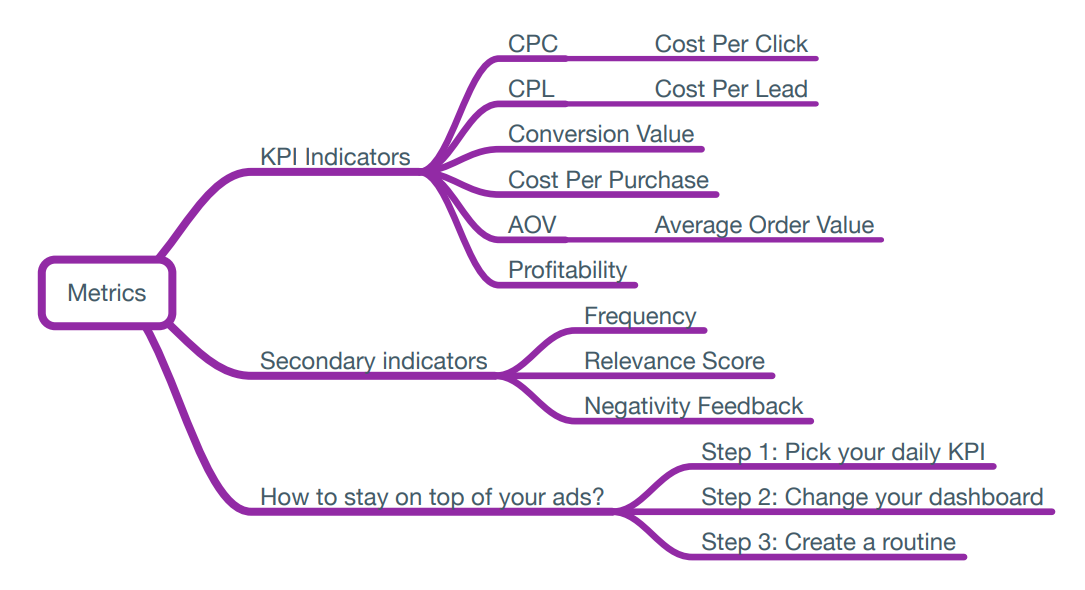
To help you formulate your strategy, I created a roadmap so you can take the right direction in selecting the right KPIs:

(Source: Connectio.io)
How to Select the Right KPIs
First of all, let’s begin by looking at the six KPIs that could be used to analyze the performance of Facebook Ad campaigns.
KPIs for Facebook Ad Management:
- Cost Per Click (CPC): Measures the average cost of each click-through from an ad. For example, if you have a budget of $100 on an ad, and you obtain 1000 clicks, then the CPC would be $0.10.
- Cost Per Lead (CPL): This covers the cost of each lead generated by your campaign. A “lead” could be anyone who communicates with your business and asks for more information. For B2B campaigns, this would be a typical indicator to focus on.
- Conversion Value: A conversion is any action that supports your goal. So, if the aim of your campaign is to get people to sign up for a newsletter, then each sign up could count as a conversion. The value is set by you and assigned to the Facebook pixel for your ad.
- Cost Per Purchase (CPP): Used by e-commerce businesses, this KPI measures the average cost of each purchase.
- Average Order Value (AOV): This can be a good indicator of how much your Facebook generated customers are spending. If they’re only paying for lower value items, for example, you could look at ways of upselling.
- Profitability: A slight overlap with conversion value here, but this is focused on the financial goals.
As you can see, trying to measure all of these KPIs for multiple campaigns will produce an overwhelming amount of data.
The first step in identifying the best KPIs for your campaign is to understand your ultimate goals.
Take a look at two different scenarios:
Scenario A: A B2B campaign for a marketing agency
B2B purchases do not happen instantly. In the decision process, your leads will take the time to understand the services you offer and the benefits it could bring.
Therefore, a Facebook Ad campaign will focus on generating leads rather than tracking purchases. As a result, your KPIs could include CPL and Conversion Value by using the action of submitting an enquiry as a conversion.
Scenario B: A grocery store
For B2C businesses, transactions tend to be much quicker processes, particularly for everyday items. A grocery store could create a campaign promoting a special offer on selected products. The aim is to entice Facebook users to make a purchase. In this case, you would use CPP to measure the success of your ad. Additionally, you could also measure the profitability of your campaign to ensure your money is being well spent.
By focusing on the KPIs that matter, your business will be able to maximize the efficiency of its Facebook campaigns.
Secondary Indicators
As well as considering the KPIs, you should look deeper into the stats and analyze the secondary indicators. These help you understand the underlying performance of your ad.
In essence, the KPIs show the value your ads are generating while the secondary indicators explain why an ad is performing in the way it is.
- Frequency: How often is your ad appearing? If your profitability is going down but the ad is still appearing frequently then it’s time to try a new one.
- Relevance Score: This is Facebook’s way of telling you how good your ad is. Starting from 1 (Very bad) to 10 (Excellent), it considers all sorts of factors including engagement, click-throughs, and comments. The higher the score is, the less it will cost you per click.
- Negative Feedback: You need to look beyond negative comments and see how many Facebook users are “hiding” your posts, or worse, reporting you for spam. If you get too many, then your account is in danger of being blocked by Facebook, your relevance score will plummet, and the CPC will skyrocket.
Together with your focus KPIs, these secondary indicators will give you a solid overview of how your campaigns are performing. It will also help you identify weak spots and areas for improvement.
Use your KPIs to monitor the overall performance and the secondary indicators to understand why your ads are performing well or poorly.
How to Stay on Top of Your Ad Campaigns
When it comes to Facebook ad management, you should get organized and maintain a focused strategy. It’s important to stay on top of the data and interpret what it’s telling you. Here are some top tips on how to do this:
- Pick your daily KPI: Even if you have whittled down your KPIs to two, it’s a good idea to have one to look at each day. This is the one that will immediately give you an answer on how your ad is performing. For example, with a B2B campaign, you would check the CPL and see whether it’s a healthy number or not. If it’s the latter, then you can take action straight away.
- Change your dashboard: You can edit your dashboard to only show information that’s relevant to you. I will demonstrate how you can do this further down the post.
- Create a routine: As well as looking at the data on a daily basis, get into a routine of testing your campaigns. This way, you can see which elements of your ads work better than others and scale up your results.
How to Change Your Dashboard:
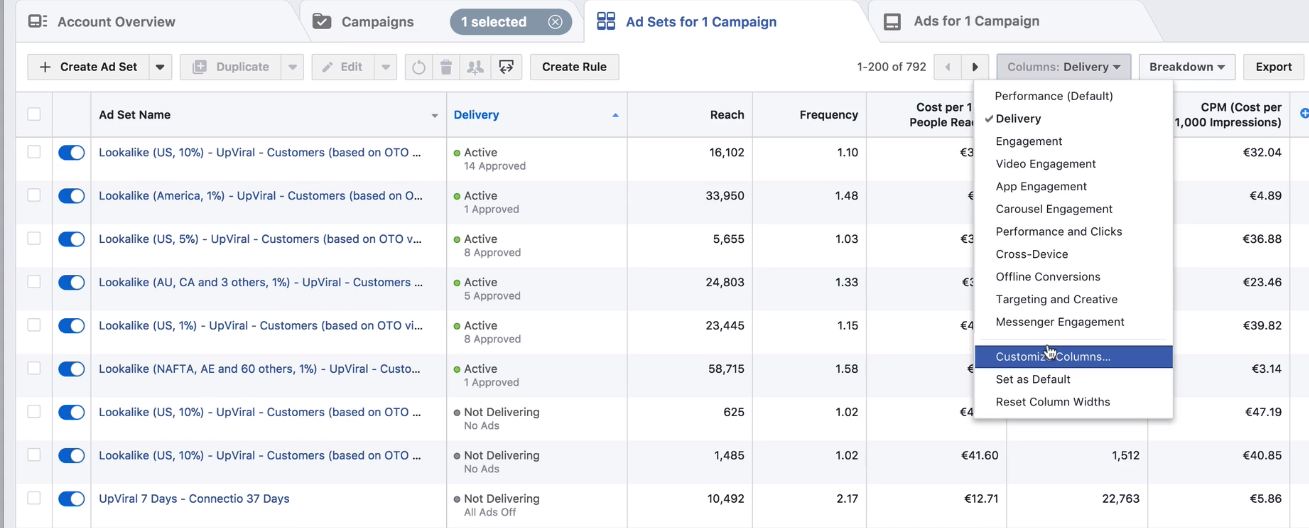
In your Facebook Ad Manager, you’ll find a dashboard with all sorts of data sets. It’s highly likely it will include columns that are not relevant to your campaign goals. So, you’ll want to come up with your own customized dashboard:

(Source: Connectio.io)
The first thing to do is to click on the “Columns” tab on the top right of the screen. You’ll find a drop-down menu, with all the different options. From there, you go down towards the bottom and click “Custom Columns:”

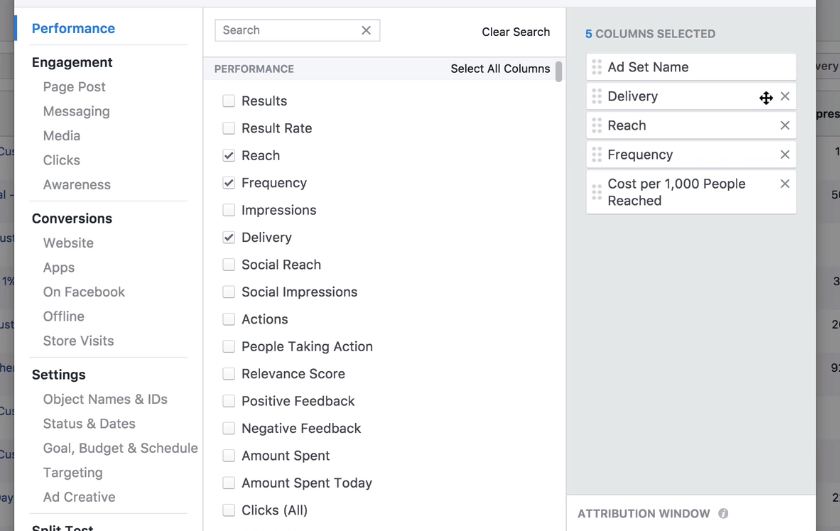
(Source: Connectio.io)
This pop-up then appears. As you can see, it has all the available options. At this point, you’ll have the opportunity to pick the columns that are relevant to your campaign. Be careful in considering which data to exclude. “Reach,” for instance, may not be one of the main indicators, but it will give you context.
For example, if your campaign has a high CPP but only has a reach of 300 people, then you should take steps to extend the reach of your ad. As a result, you may see your CPP come down significantly.
How to Use Metrics to Scale Up Your Campaigns
The important thing here is to proactively use the data available to identify patterns in your campaign. By picking the right metrics to focus on, you’ll have the ability to see which campaigns are working and scale up your budget accordingly. After all, if you can see every $1 spent is giving back $10, then you’ll want to spend every $1 you can.
Final Thought
To fully utilize Facebook’s enormous advertising potential, you need to go back to basics. The amount of data can be overwhelming, so focus on the ones that matter. You can do this by outlining the goals of your campaign, whether it’s to sell a product or getting people to sign up for a webinar. Both of these campaigns will have different KPIs.
Once you have identified the KPIs to focus on, you should take the opportunity to analyze the data in depth. Remember to use the secondary indicators which will give you a complete picture of how your ad is performing.
You will then be able to use the data to make adjustments and improve your campaigns.
At Connectio, you can do all this and run your campaigns from one, easy-to-use platform. In today’s ever-increasingly competitive world, it will provide you with the edge over your rivals when it comes to Facebook ad management.

